Tracking Blocked Firewall Events with pfSense & Elasticsearch
Learn how to configure pfSense to send firewall events to your Elasticsearch cluster and visualize them in Kibana.

Introduction
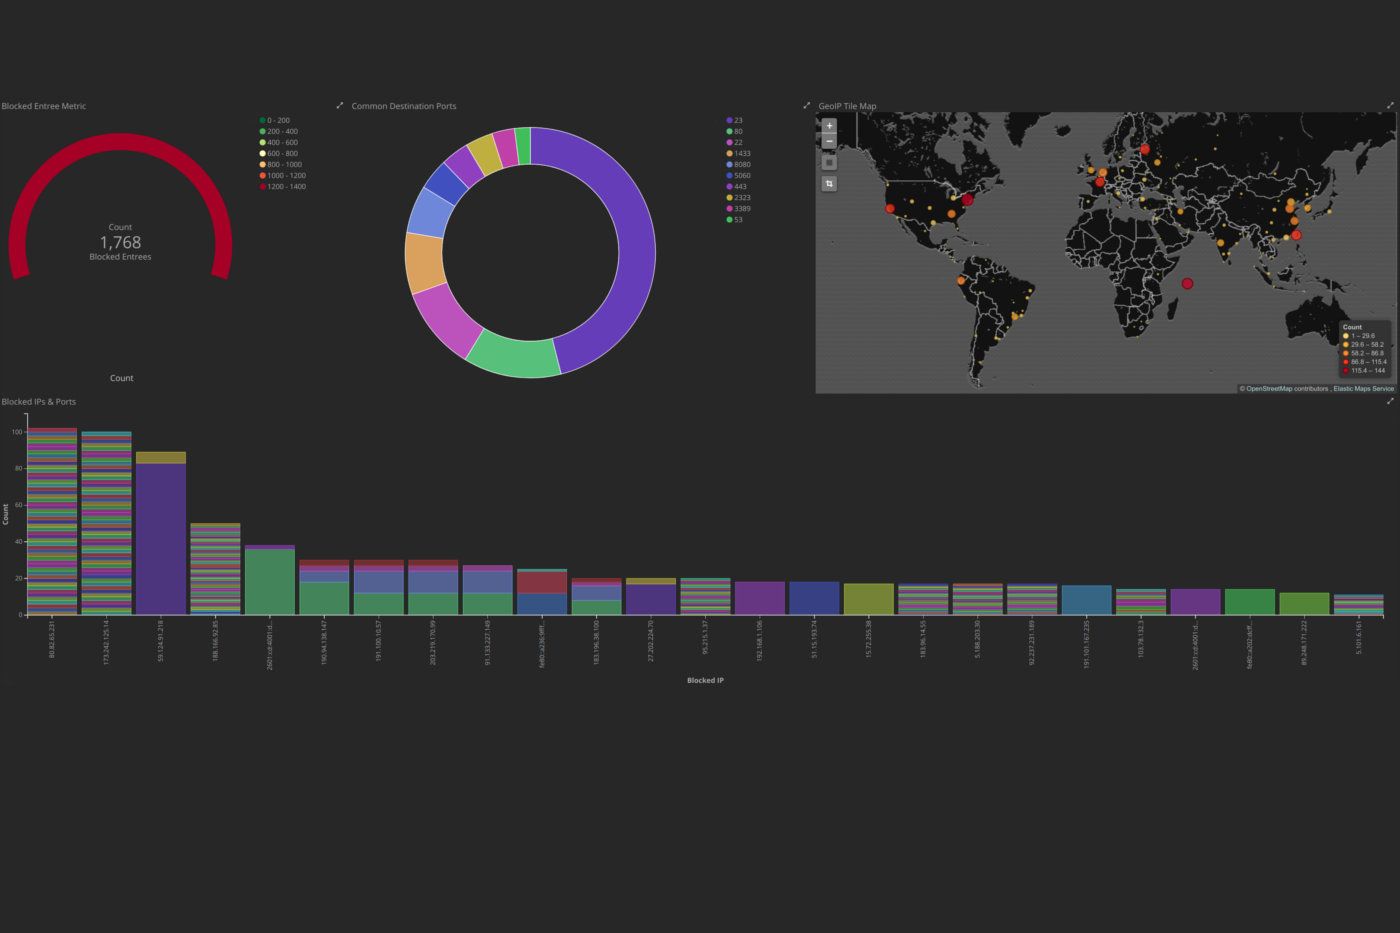
In this very exciting post, we will be learning how to configure a pfSense firewall to send Syslog events to a remote Logstash server, process the events to gather important data using Logstash and Elasticsearch, as well as setting up Kibana for some interesting visualizations. This can give a system administrator important information about attempted mappings of his or her network as well as potential attacks on any systems and services. We will also be looking at common trends in remote connections seen through the dashboards.
Intallation
All of the configuration needed for the installation can be found at my logstash-pfsense repository on github. This will include all of the current Logstash configurations and the visualizations and dashboard files for Kibana.
Interpreting Common Events
Let's look at how we can interpret some of the common results one may find on the Kibana dashboard.
Single Port Events

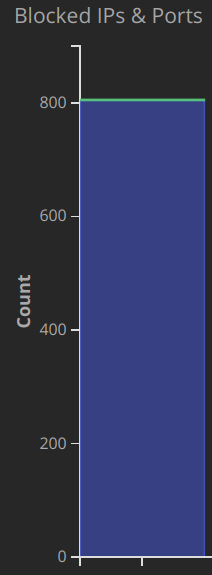
In what I will be referring to as a single port event, a remote host sends a large number of requests to a single port in an attempt to find common vulnerabilities. In the above example, an attacker sent 800 HTTPS requests to the network most likely looking for known flaws in commonly used web services.
Here is a list of common TCP ports in which an attacker may attempt to look for vulnerabilities. It is ordered by most occurring from the data that I have gathered in the last six months.
- 23 - Telnet
- 5355 - Link-Local Multicast Name Resolution
- 80 - HTTP
- 1433 - MSSQL
- 22 - SSH
- 443 - HTTPS
- 5060 - SIP
These TCP ports in particular should be locked down with rules that should only allow remote access to them from known IP ranges. Better yet, close all ports through the WAN interface and require remote access through VPN tunnels. For ports that must be open to the public, such as HTTP or HTTPS, it is important to use some form of authentication with a strong encrypted password or throttling techniques to prevent unwanted intrusions and bandwidth usage. And remember, always keep servers and services up to date!
Port Scanning Events

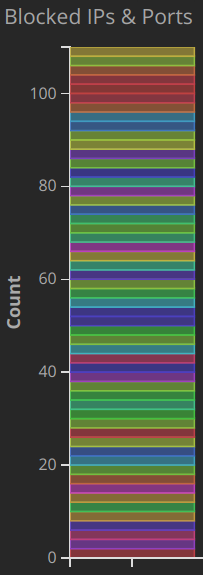
Port scans are an attempt for a remote host to map open ports and detect running services and hosts on the internal network. In this example, we can see that a single source IP address attempted to probe a number of ports. This is often done before an attack in order to better understand what is running for an attacker to exploit. Some non-malicious hosts will also use scanning techniques to simply map the Internet and have no intention of trying to penetrate.
Again, to protect a network from a port scan, make sure that only ports that need to be exposed are configured in the firewall.
Conclusions
All seasoned system administrators understand that their networks are being scanned and checked at surprising rates. But it might not be obvious to home users that they are being mapped as well. For instance, on my home network with no open ports to the public, there have been over 5,000 blocked events in the last 24 hours. Some of these are clearly from TCP scanning tools, such as nmap and some of them are blind attempts to exploit vulnerabilities in common web services.
In terms of how to protect yourself from these unwanted connections, a conscientious net user should deploy strict firewall rules and keep the systems up to date. Truth be told, there is not much to be done to stop these attempts similar to stopping phone fraud or scam emails. It is best to act defensively and show an attacker that you are not worth the effort.
With the help of these open-source technologies, it is now very easy to visualize the block events that are generated from a pfSense firewall. This can give great insight into what is happening just outside your own front door and keep you aware of any major attacks on your network.
